General MATLAB Functions
In order to use these functions in MATLAB, they must be in a MATLAB path.* Neither function requires any MATLAB Toolkits and should be usable with the vanilla version (created in 2016b).
*For details on how to add user functions / folders to MATLAB paths, making your own startup.m may be useful.
[top]
*For details on how to add user functions / folders to MATLAB paths, making your own startup.m may be useful.
[top]
The file can be found on the MathWorks File Exchange here.
averagesmooth.m smooths 1D data sets by averaging over neighboring data points. The function accepts a linear set(s) of data and how many neighbors (in one direction) you want to average each data point over. It returns the smoothed data set(s).
Inputs:
(x1 + x1 + x1 + x1 + x2 +x3 +x4) / 7
i.e.: (3 points of padding using point 1 + point 1 + points 2, 3 and 4) / 7
Below is an example of using the function on a noisy sine wave.
averagesmooth.m smooths 1D data sets by averaging over neighboring data points. The function accepts a linear set(s) of data and how many neighbors (in one direction) you want to average each data point over. It returns the smoothed data set(s).
Inputs:
- data -- any linear data set (it can have multiple sets, i.e. 2161x6 will smooth 6 sets of 2161 points)
- smoothwidth -- is a natural number, with 0 meaning no smoothing, 1 meaning nearest neighbors are included in the average (3 pts), 2 meaning nearest and next-nearest are included (5 pts), etc..
(x1 + x1 + x1 + x1 + x2 +x3 +x4) / 7
i.e.: (3 points of padding using point 1 + point 1 + points 2, 3 and 4) / 7
Below is an example of using the function on a noisy sine wave.
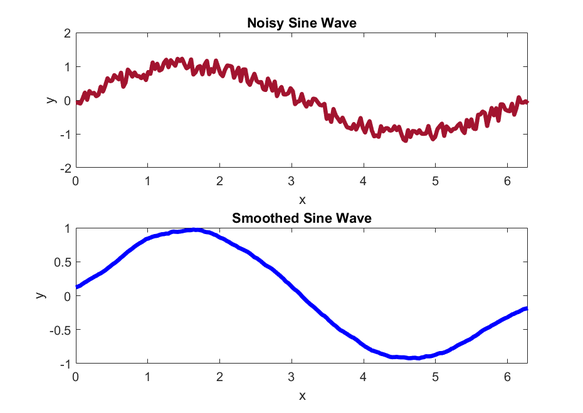
The data set is 201 points, and the noisy sine wave is smoothed using averagesmooth.m with a smooth width of 20.
[top]
[top]
The file can be found on the MathWorks File Exchange here. It does not require any toolkits to run.
eeconv2.m is used to perform convolution on an image (2D array); introduction to the concepts can be found here, and here, and here.
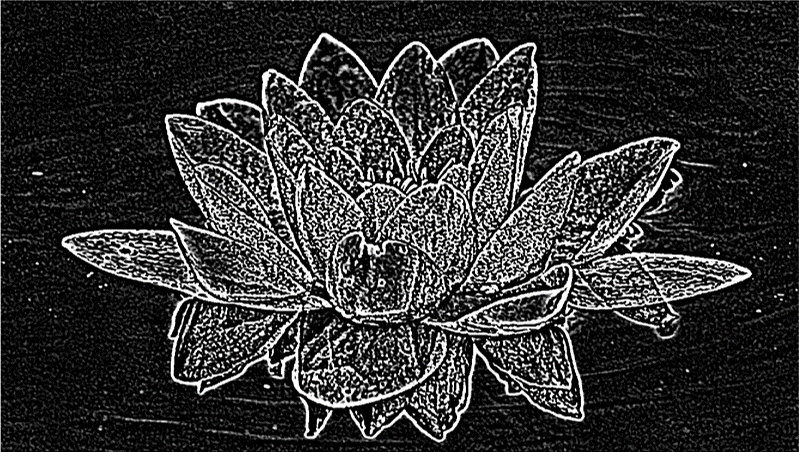
Here is an example of how to use the convolution to detect edges. First, make the image greyscale, then use eeconv2.m through several applications of a Gaussian blur kernel (in this case 30 times), then the edge detection kernel.
eeconv2.m is used to perform convolution on an image (2D array); introduction to the concepts can be found here, and here, and here.
Here is an example of how to use the convolution to detect edges. First, make the image greyscale, then use eeconv2.m through several applications of a Gaussian blur kernel (in this case 30 times), then the edge detection kernel.

|
|
I developed this program because of how vanilla MATLAB handles edge pixels, which is to either ignore them (resulting in a smaller image) or to pad the outside of the MATRIX with zeros (causing a strange frequency discontinuity). In eeconv2.m the convolution is done with padding that consists of repeated edge values out into the padding (edge extension, hence the "ee" in the file name); this results in an image the same size as the original image, and without the discontinuity.
Program call:
result = eeconv2(kernel,targetMat)
Inputs
- targetMat -- the image to be acted upon
- kernel -- the kernel to act upon the image
Outputs
- result -- the convolved imageI wanted a program to have a kernel (kernel) convoluted with an image (targetMat) using edge extension rather than the MATLAB default padding with zeros; the resulting matrix (result) is the same size as the original image. This program does not require any toolkits.
Notes
- kernel is odd (e.g., 3x3, 5x7) so that there is a center pixel
- minimum kernel is 3x3
- maximum kernel is the size of the target matrix
This is my first such program; let me know if it is useful and if you have issues so that I can address them. Thank you!
[top]
